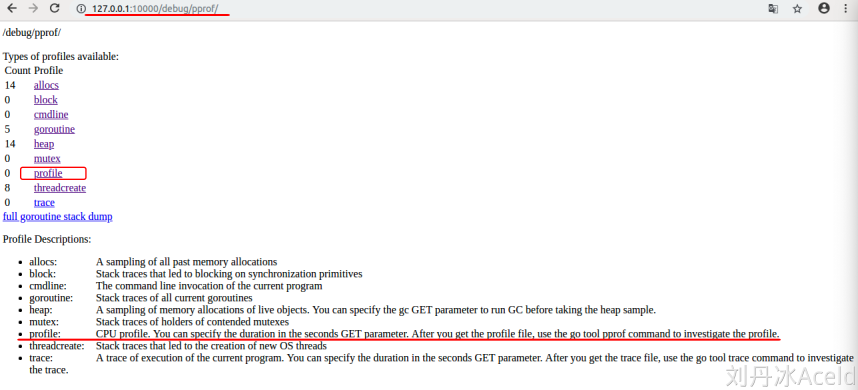
更新时间: 2023-04-08 08:36:46#go 性能runtime.ReadMemStats + pprof#runtime.MemStats var ms runtime.MemStats runtime.ReadMemStats(&ms) https://pkg.go.dev/runtime#MemStats #pprof工具import( "net/http" _ "net/http/pprof" ) go func() { log.Println(http.ListenAndServe("0.0.0.0:10000", nil)) }() http://127.0.0.1:10000/debug/pprof/heap?debug=1 go tool pprof [binary] [profile] 我们上面的profile文件是通过web浏览器下载的,这个profile的经过时间是30s的,默认值我们在浏览器上修改不了,如果你想得到时间更长的cpu利用率,可以通过go tool pprof指令与程序交互来获取到 ./demo4 启动程序 go tool pprof http://localhost:10000/debug/pprof/profile?seconds=60